Automating Clinical Trial Landscaping with Edison Analysis
Angela Yiu
Date:
01.21.2025
Automating Clinical Trial Landscaping with Edison Analysis
Comprehensive landscaping of clinical trials is essential to drug development and competitive intelligence, yet it remains a labor-intensive task. Identifying relevant trials, extracting their current status, and standardizing diverse mechanisms of action (MoA) across thousands of entries can be a bottleneck that typically takes days of manual work.
Edison Analysis is able to automate this process with a simple prompt:
"List all clinical trials for triple negative breast cancer. Output a table of trials with phase, sponsor, MoA and status."
Data Retrieval and Cleaning
In a single run, the agent retrieved 1,268 interventional clinical trials and returned a table with the four requested columns together with NCT ID.
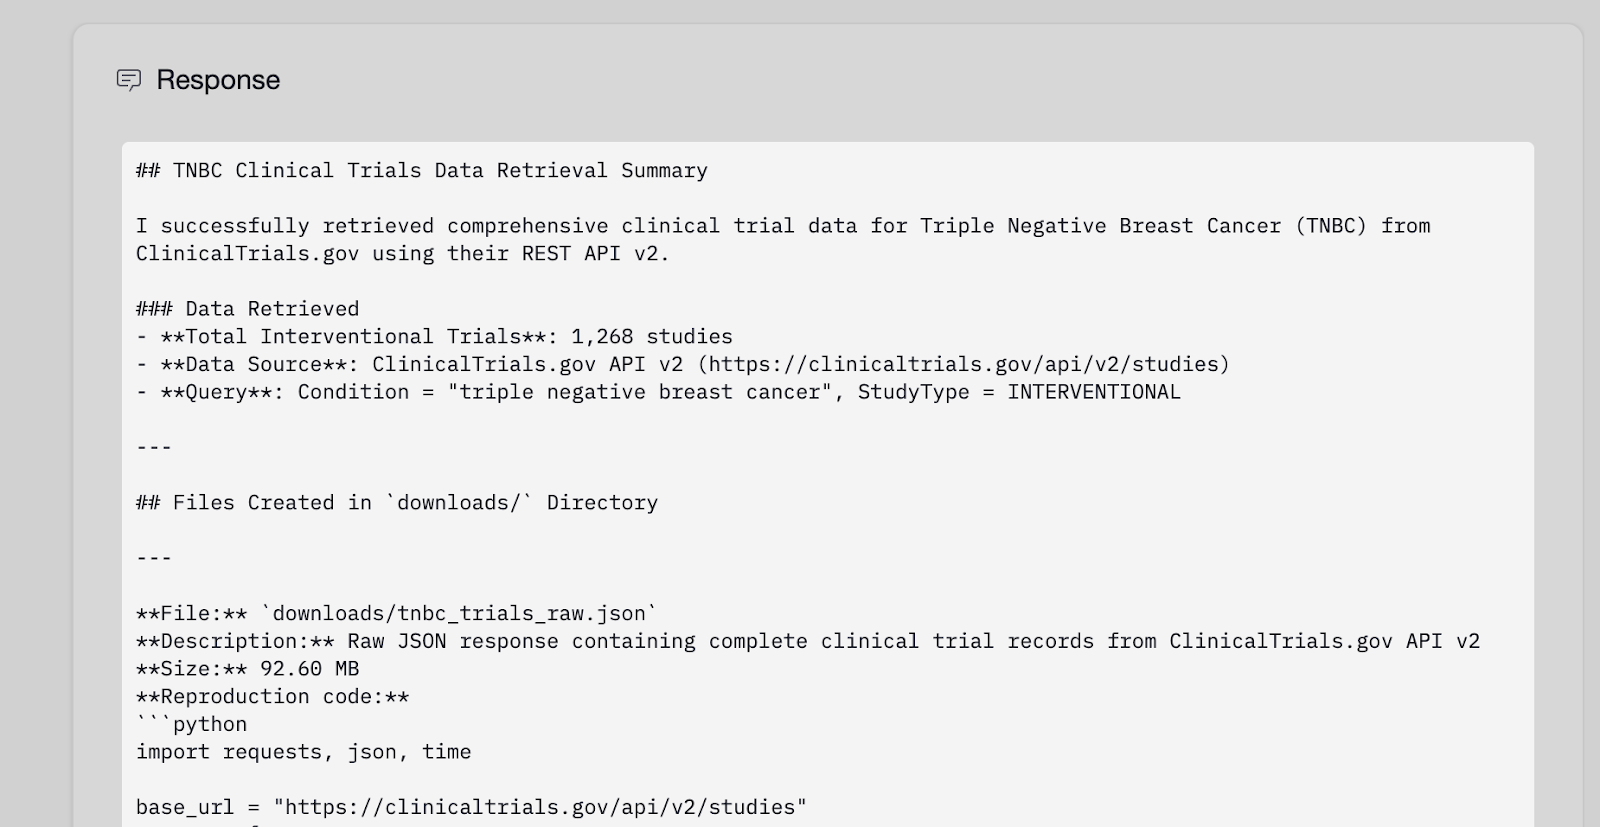
The process began with the agent connecting directly to the ClinicalTrials.gov API to retrieve over 1,200 interventional trials. The agent then performed data cleaning and harmonization. For instance, it mapped heterogeneous intervention descriptions, such as "microtubule stabilizer" or "DNA crosslinker", into standardized Mechanism of Action (MoA) categories. This allows researchers to immediately see therapeutic trends rather than going through raw, inconsistent text manually.
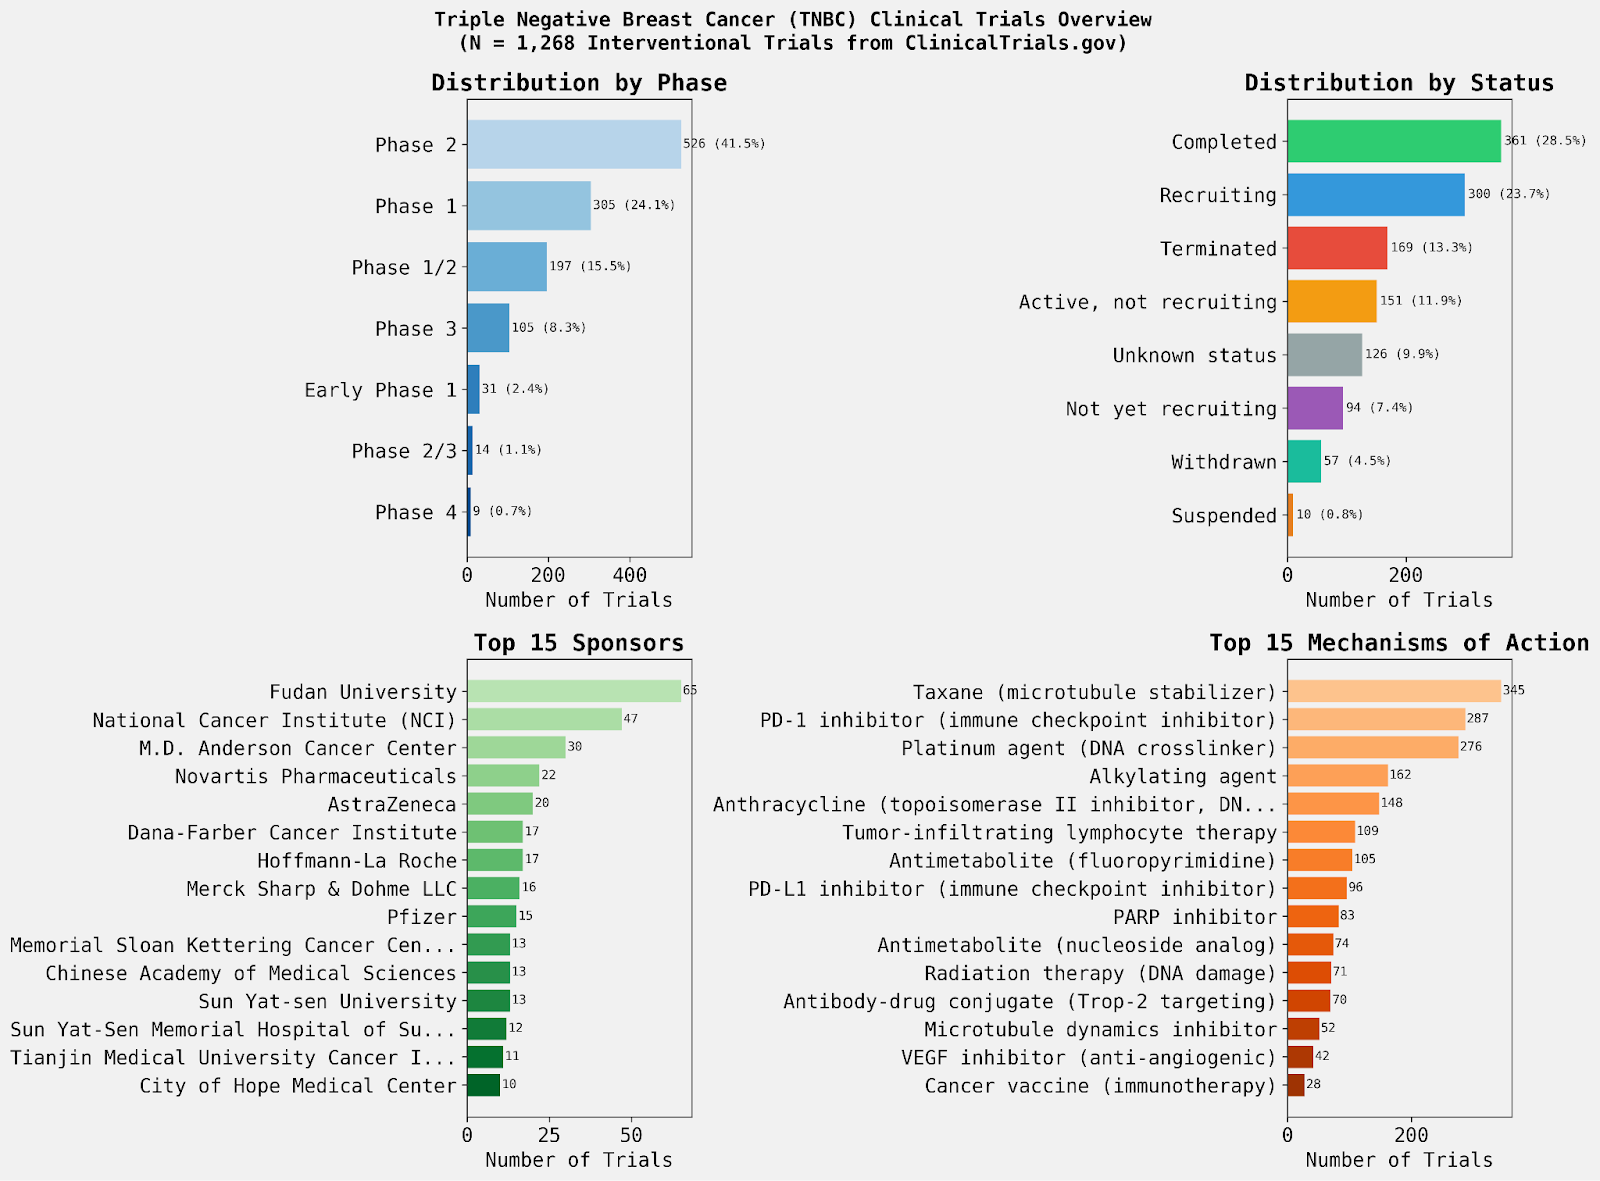
Landscape visualization
To provide an immediate high-level view, the agent also generated a multi-panel visual summary of the data. This allows researchers to identify the most active sponsors, the current clinical phase distribution, and the dominant therapeutic modalities in the triple negative breast cancer (TNBC) space at a glance.
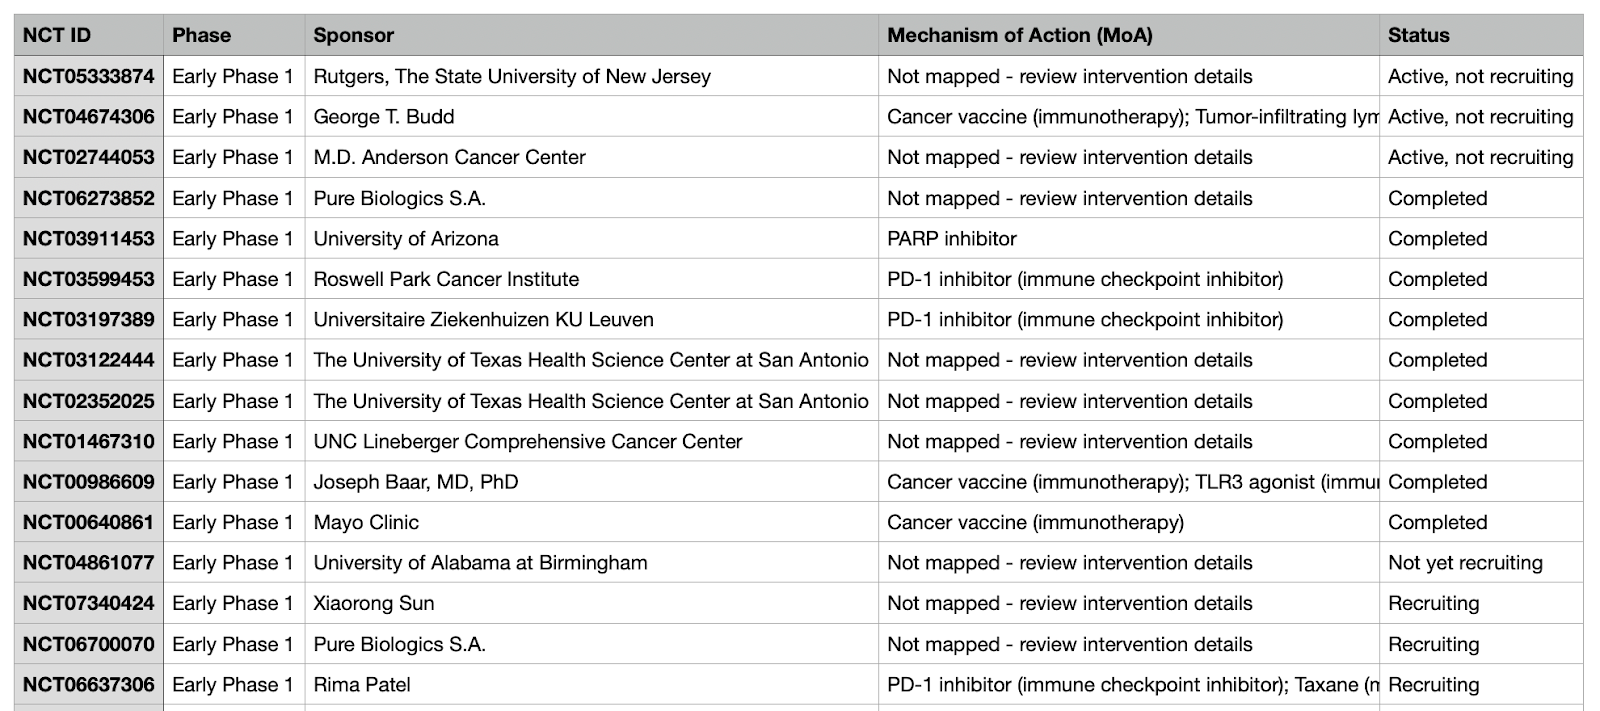
Structured, Auditable Outputs
The final output provided by the agent was a downloadable, clean table containing the exact parameters requested. Because the agent operates entirely within a transparent notebook environment, every step of the filtering and mapping logic is auditable. Researchers can download the full notebook and the curated CSV files to local environments for further custom analysis.
By automating data aggregation and cleaning, Edison Analysis allows scientists to spend less time on data wrangling and more time on the strategic interpretation of the clinical landscape.