Reproducing Key Findings from Handsaker et al. on CAG-repeat Expansions in Huntington’s Disease
Asmamaw (Oz) Wassie, Michaela Hinks
Date:
01.23.2026
Huntington’s Disease (HD) is a devastating neurodegenerative disorder caused by CAG-repeat expansions in the DNA encoding the huntingtin (HTT) gene. A long-standing mystery has been how the CAG repeats cause neurodegeneration beginning in midlife despite being present since birth. In a remarkable study, Handsaker et al. shed light on this mystery by using single nucleus RNA-seq (snRNA-seq) and PacBio long-read sequencing of the HTT gene to identify that CAG repeats are likely expanding in neurons for decades, but only become toxic after they reach 150 copies or more. Here, we demonstrate that Edison Analysis can recapitulate key claims from Handsaker et al. by autonomously retrieving and analyzing their publicly available, pre-processed data. The pre-processed data for this manuscript is available in the NeMO archive, and includes single nucleus read counts and indices in h5py files for individual donors, as well as donor and sequencing metadata. Specifically, the Analysis agent found that HD samples with large repeat expansions show loss of SPNs, and that it takes at least 140-150 CAG repeats in HTT to significantly disrupt SPN gene expression profiles.
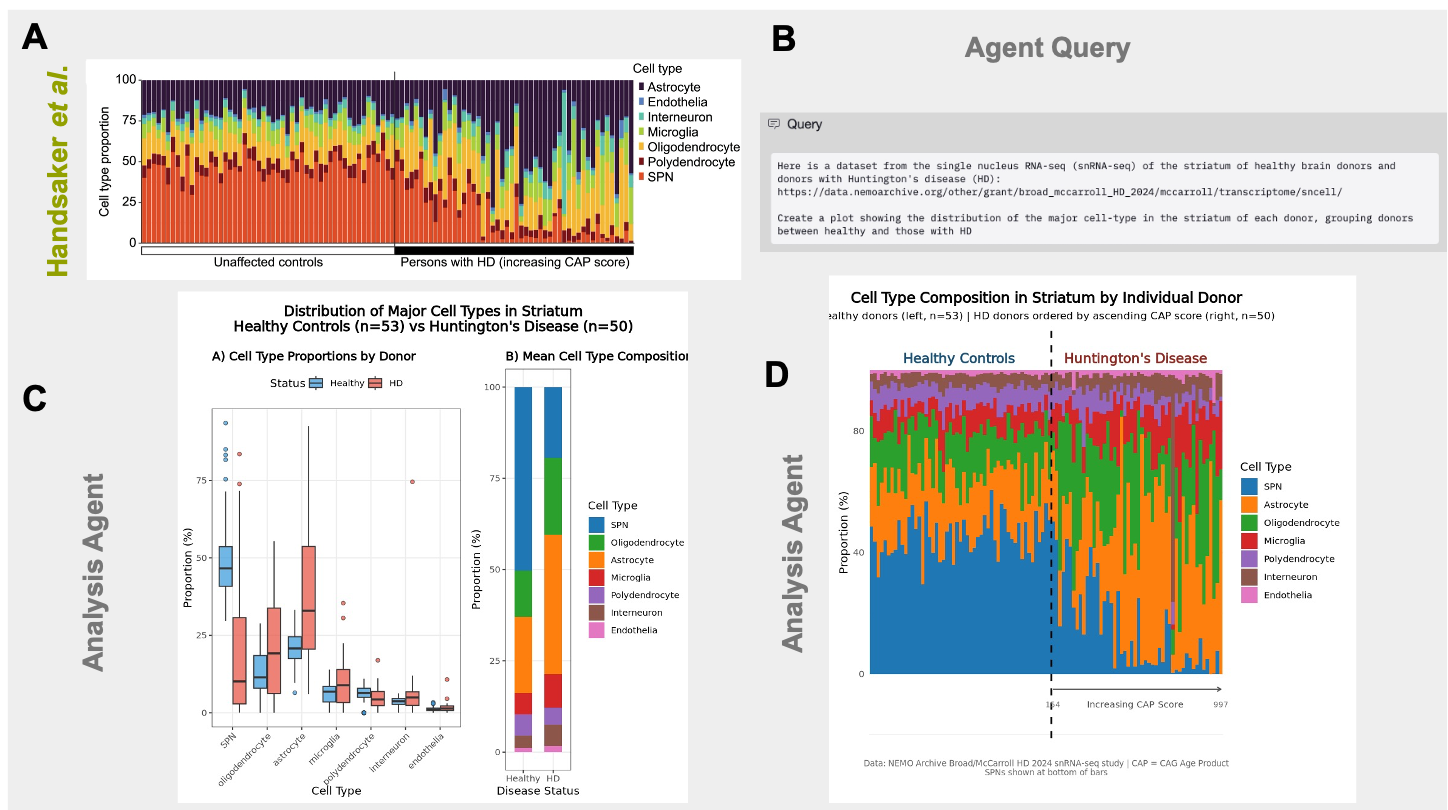
Edison Analysis Agent Identifies the Loss of Striatal Projection Neurons (SPNs) in Huntington’s Disease (HD) Individuals with Large Repeat Expansions
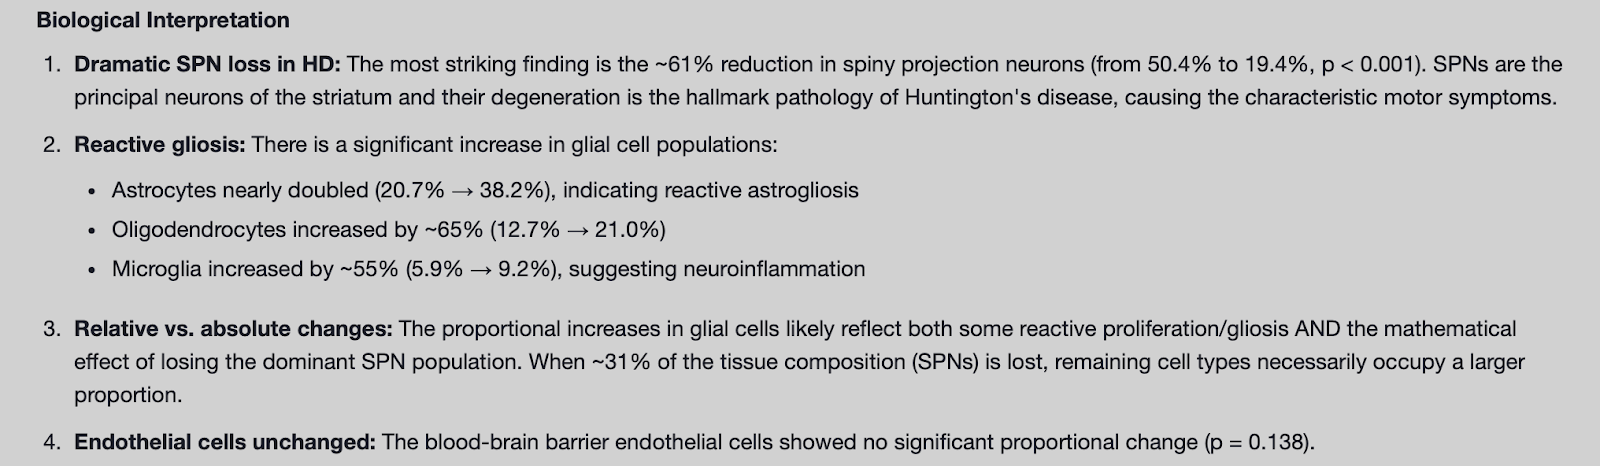
We were first interested in reproducing the first key finding of the publication: loss of SPNs in the striatum of HD donors (Figure 1A). We provided a brief query to the Edison Analysis agent instructing it to access the url of the publicly available dataset and to analyze the distribution of cell types between the striatums of healthy and HD donors (Figure 1B). After automatically finding the necessary donor and single cell metadata files, the Analysis agent calculated the cell type proportions in each of the healthy and HD samples (Figure 1C). As in the paper, the plot generated by the Analysis agent showed a significant loss of SPNs in HD. The Analysis agent then went beyond its initial query and provided biological and clinical interpretation of this result, not only noting the dramatic loss of SPNs as expected in HD, but also identifying changes in astrocyte and microglia distributions that indicate astriogliosis and inflammation (Figure 2). Next, when instructed by a follow up prompt to create stacked barplots of individual donors and rank HD donors based on CAP (CAG-age-product) score, the Analysis agent produced a plot similar to Fig 1A of the Handsaker et al. manuscript (Figure 1D).
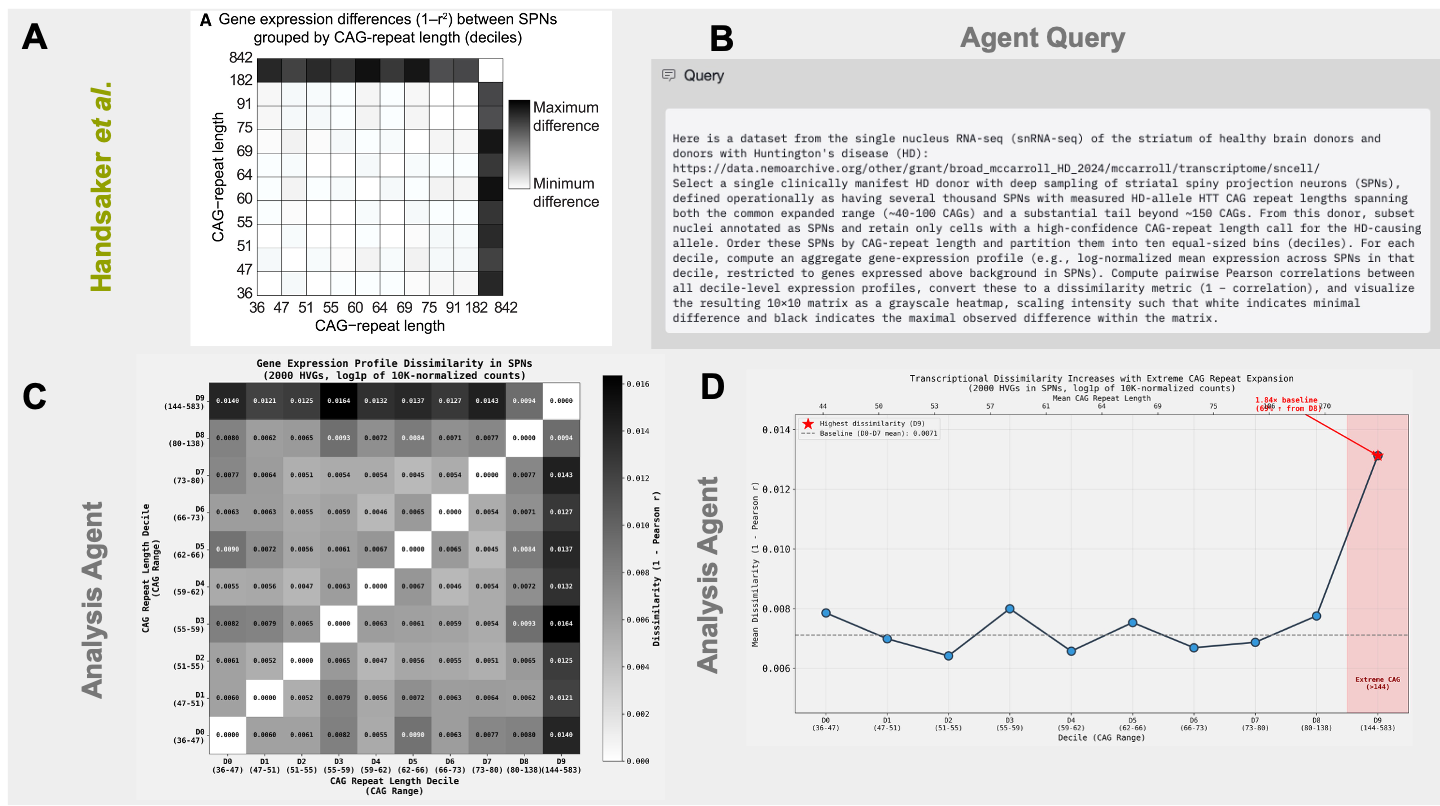
Edison Analysis Agent Uncovers Repeat Length Threshold for Altered Gene Expression in SPNs in HD
Next, we wanted to reproduce the striking result in Figure 3 of the paper, which shows that only CAG-repeat expansions greater than 150 repeats results in altered gene expression patterns in SPNs (Figure 3A). Independently reproducing Figure 3A using their pre-processed data requires selecting a suitable donor for the analysis, filtering SPNs from the 10x sn-RNA-seq dataset, integrating this data with the PacBio long read sequencing, and filtering of variable genes. Here, we demonstrate how the Edison analysis agent was able to execute this workflow to produce a plot similar to Figure 3A of the original manuscript and arrive at the authors’ main claim that only large repeat expansions change global gene expression in SPNs.
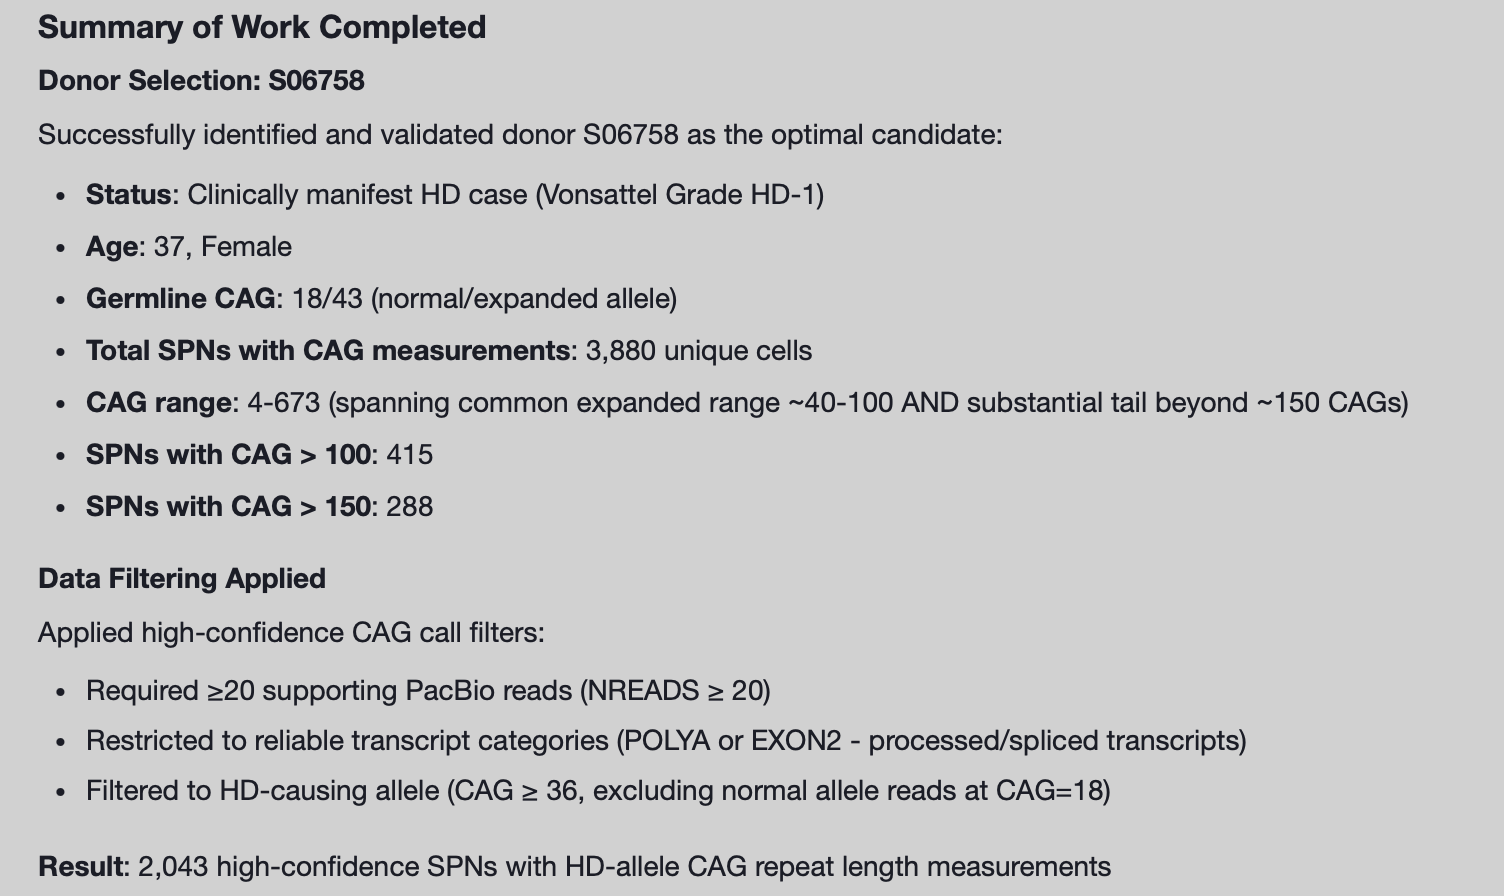
We first provided the Analysis Agent a detailed prompt instructing it to access the data at the NeMO url, select a suitable donor with the same criteria used in the paper (namely that the donor has paired sequencing data, CAG repeats in SPNs that cover a large range, sufficient SPNs, and manifesting HD), and investigate changes in gene expression of SPNs with varying CAG repeats (Figure 3B). Specifically, we instructed the Analysis agent to compare gene expression across SPNs grouped into deciles by CAG-repeat length. First, the agent retrieved the donor and sequencing metadata and identified S06758 (Donor 4 in the paper) as the suitable candidate (Figure 4). Next, the agent correctly identified greater dissimilarity of gene expression patterns in SPNs with large repeats, but the signal was poor, likely because the agent included a large fraction of genes in the analysis (Analysis Trajectory).
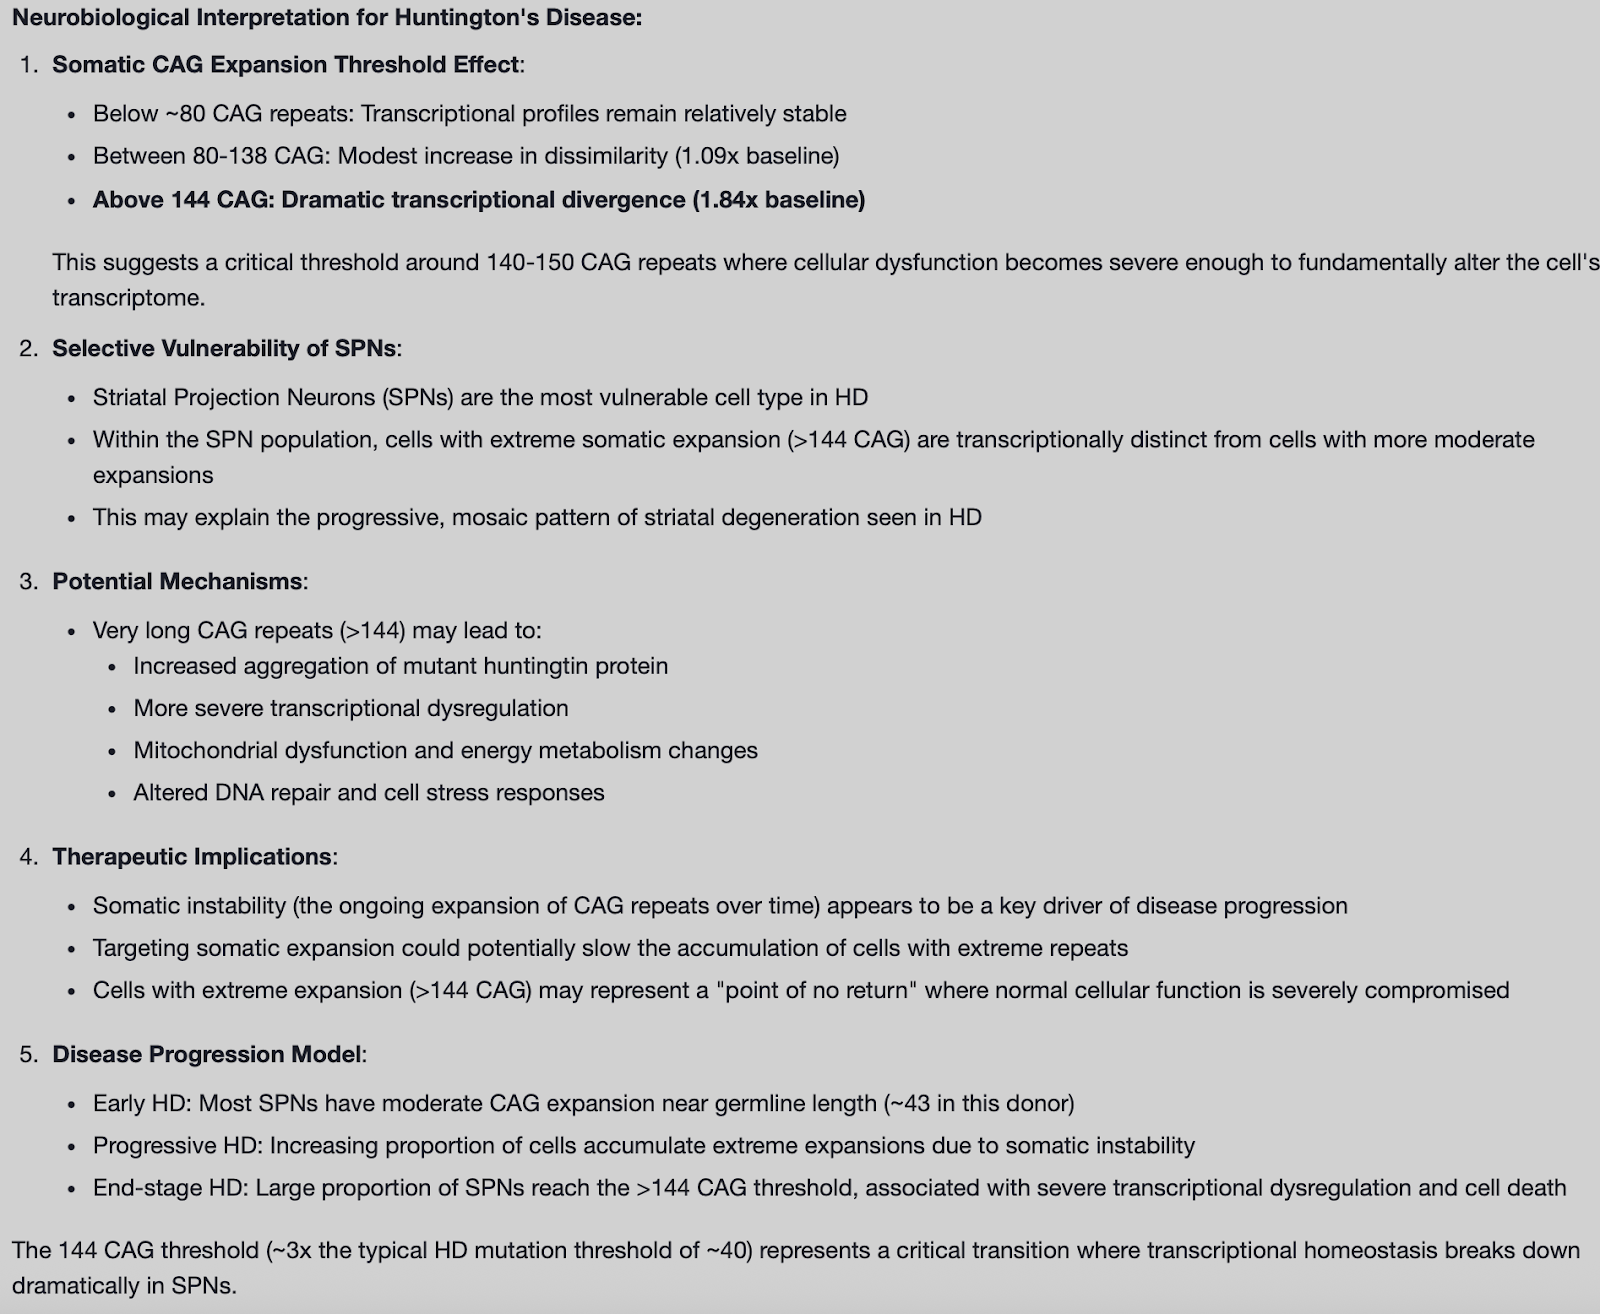
After an explicit followup prompt to use log1p normalization and focus on only highly variable genes as Handsaker et al. did, (to avoid constitutively expressed house-keeping genes that might dilute SNR), the Analysis agent identified that transcriptomic dissimilarities between SPNs arise only for neurons with CAG repeats greater than 144, very similar to the 150 CAG repeat threshold reported in the manuscript (Figure 3C, D). We suspect this slight difference is because (1) the Analysis agent used 1-r (vs 1-r2) as the measure of dissimilarity and (2) the Analysis agent only used one of five replicate 10x snRNA-seq runs, which we would expect to reduce the SNR. The Analysis agent generated hypotheses for the mechanism of the toxicity of large repeats, highlighting protein aggregation and mitochondrial dysfunction as possibilities (Figure 5). Finally, the Analysis agent provided insights into therapeutic implications of this finding, such as targeting somatic expansion as a treatment possibility.
When prompted, the Analysis agent provided a rich biological and clinical interpretation of its analysis on the effect of CAG-repeat length on SPN gene expression and Hungtington’s disease neurobiology (Figure 5).
In summary, the Edison Analysis agent reproduced key findings from a single cell transcriptomic study on large repeat expansions in HD by directly accessing an external dataset, and conducting autonomous data exploration and analysis. Though the Analysis agent did not access the manuscript in its trajectories, the text may be present in the training data used by the LLM agent. While it took about 2 hours for the Analysis agent to perform the analyses shown here, we estimate it would have taken us at least a day to do the same (including data orientation and ingestion, reconstructing the right data subset, matching the paper’s processing flow and executing the necessary analysis steps). This ability of the Edison Analysis agent to carry out accurate multistep transcriptomic analyses with few prompts opens the doors for drawing insights from the growing and ubiquitous disease-relevant single cell RNA-seq datasets being generated worldwide.