Edison Analysis Builds Multi-Database Knowledge Network
Arvis Sulovari
Date:
02.11.26
Knowledge networks are powerful visualization tools in biology because they expose shared molecular relationships between seemingly unrelated genes and diseases. This helps motivate mechanistic hypotheses that can guide drug discovery and repurposing. Mapping these relationships requires querying multiple databases, normalizing heterogeneous data formats, and assembling results into a coherent network. This process typically takes hours of manual work. Edison Analysis automates this with a simple prompt:
"Show connections between TYK2 and MAPT. Produce an interactive network which relies on data from Public knowledge graphs and DBs (including but not limited to STRING, OpenTargets, GeneCards), and the published literature."
The full trajectory is available here.
Data Retrieval and Integration
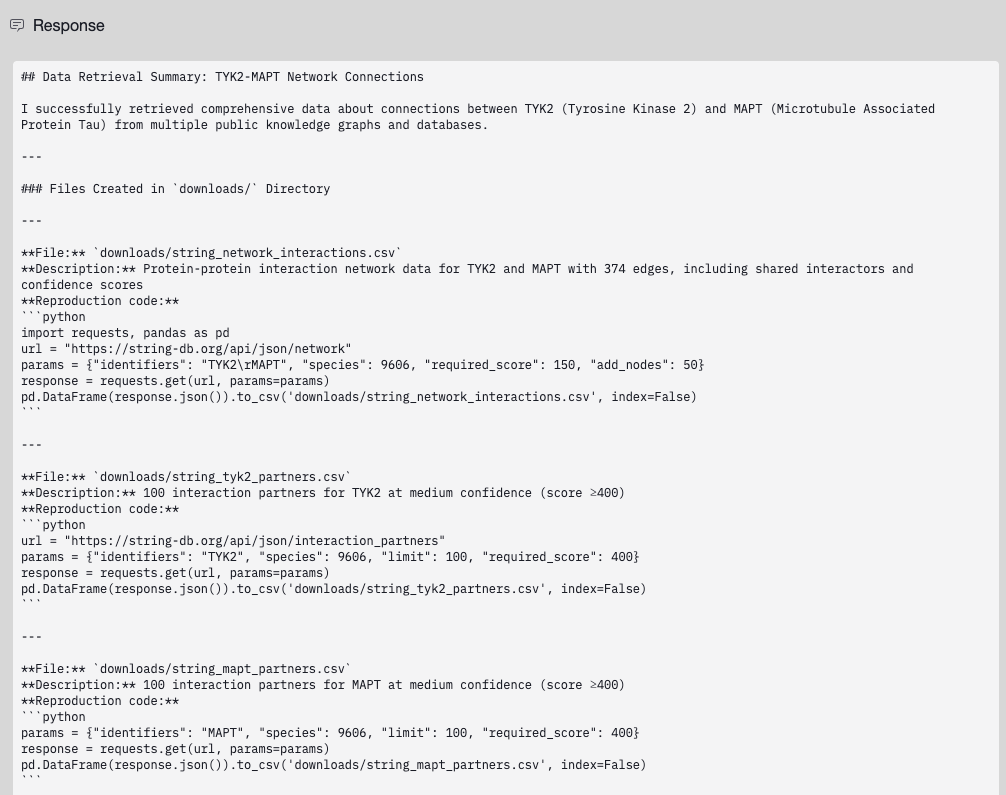
In a single run, the agent queried six public databases to assemble a comprehensive view of TYK2-MAPT connections. It retrieved 374 protein-protein interactions from STRING, disease association data from OpenTargets, pathway memberships from KEGG and Reactome, protein annotations from UniProt, and literature co-occurrence data from PubMed.
The Analysis agent identified EGFR as a shared high-confidence protein interactor, with STRING scores of 0.821 (TYK2-EGFR) and 0.830 (MAPT-EGFR). It also discovered 13 shared disease associations, including COVID-19, neurodegenerative disease, type 1 and type 2 diabetes, and autoimmune conditions. From PubMed, the agent found 5 publications that directly mention both TYK2 and MAPT.
Network Construction and Visualization
To provide an integrated view of the TYK2-MAPT relationship, the agent constructed an interactive network visualization. Nodes are categorized by type (main genes, interactors, diseases, pathways, biological processes), and edges represent different relationship types (protein interaction, disease association, pathway membership).
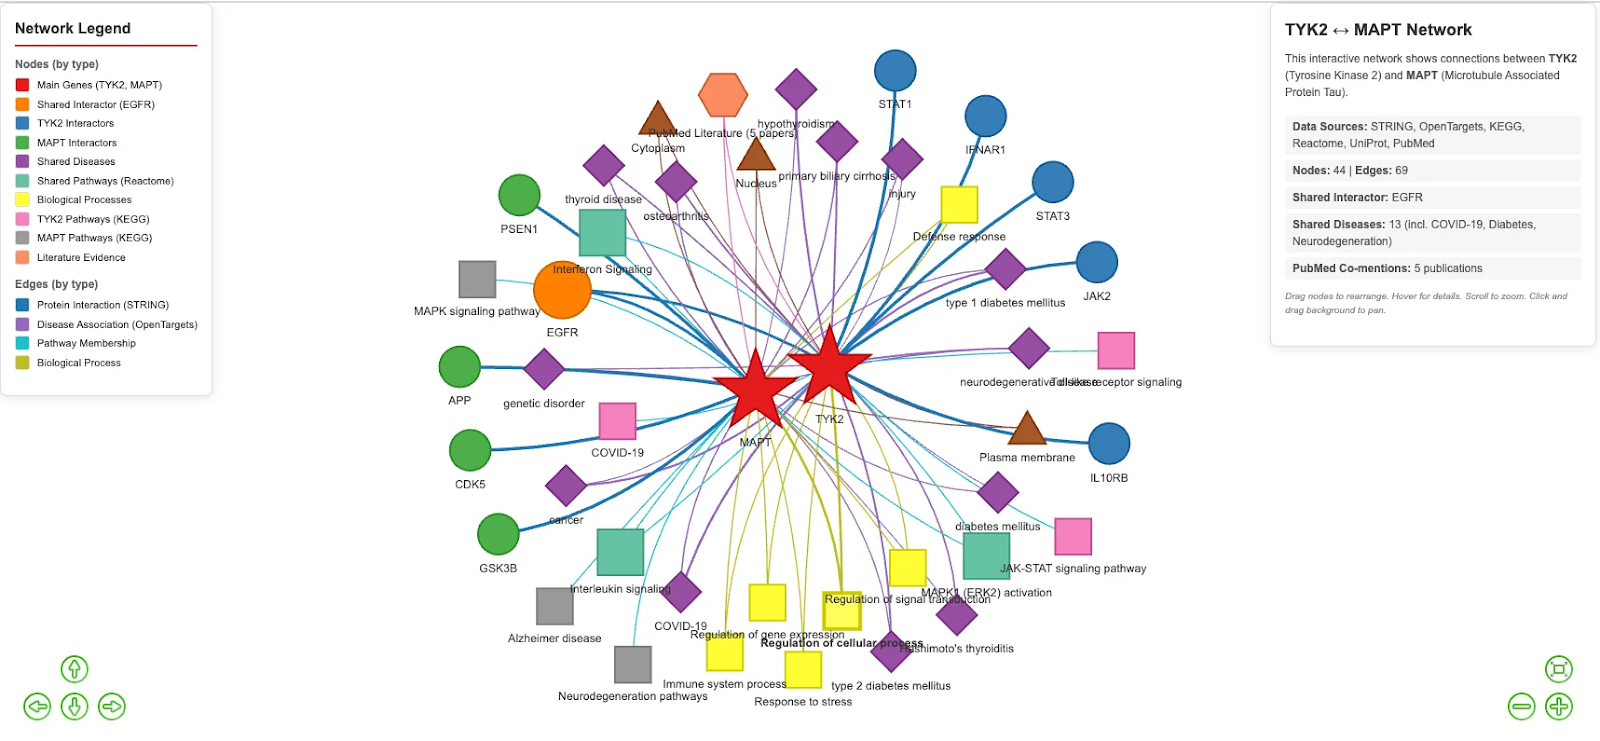
The visualization reveals that TYK2 and MAPT, despite belonging to distinct biological pathways (JAK-STAT signaling vs. cytoskeletal regulation), share a direct molecular link through EGFR, converge on neuroinflammatory disease associations, and participate in overlapping signaling cascades, including Interferon Signaling and MAPK1/ERK2 activation.
Structured, Auditable Outputs
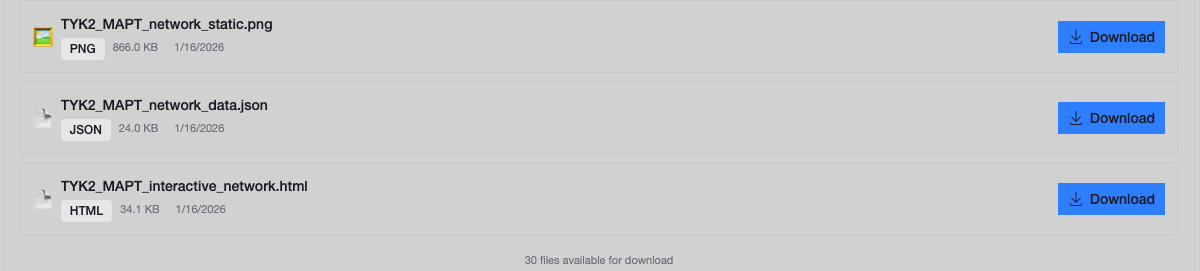
The final output provided by the agent includes multiple downloadable files: an interactive HTML network (viewable in any browser), a JSON file containing complete network data, and a static PNG image. All source data files from each database query are preserved for audit and further analysis.
By automating multi-database queries and network assembly, Edison Analysis enables researchers to rapidly explore gene-gene relationships across protein interactions, disease associations, and literature evidence, providing a foundation for hypothesis generation in minutes. Importantly, this analysis is grounded in verifiable quantitative data: STRING confidence scores provide statistical weight to each protein interaction, OpenTargets associations are backed by curated evidence from genetics, transcriptomics, and clinical data, and PubMed co-occurrences link findings to the primary literature. Every data source is preserved in the trajectory, so researchers can trace any edge in the network back to its origin and independently verify the result.