Edison Analysis Reproduces Microscopic Image Analysis Workflow
Angela Yiu
Date:
02.04.2026
To demonstrate image analysis capabilities of Edison Analysis, we tasked the agent with reproducing a classic microscopy analysis: the quantification of protein re-localization from the cytoplasm to the nuclear envelope. By utilizing the skimage library and time-series data, the agent successfully segmented nuclear boundaries and measured fluorescence intensity changes over time. Follow up tasks can then be used to finetune the methods as specified by the user.
This example demonstrates the agent’s ability to not only follow complex image processing instructions but also to make autonomous, data-driven decisions that match the precision of expert human analysis. The full trajectory is available here.
Task: Quantifying Protein Re-localization
In cellular biology, the movement of proteins between compartments, such as from the cytoplasm to the nuclear envelope, is a fundamental regulatory mechanism. Quantifying this movement requires precise segmentation of the nuclear boundary (the "envelope") across multiple timepoints in a 4D dataset (time, channel, x, y).
The agent was provided with the following initial prompt:
Install skimage and fetch example data using ski.data.protein_transport(). Using DAPI, create a mask for the nuclear envelope per timepoint. Measure the fluorescence intensity localized to the nuclear envelope which shows a process of protein re-localization from the cytoplasmic area to the nuclear envelope. Ensure the rim size of the mask is covering expected nuclear envelope staining, adjust if necessary. Plot normalised intensity against time.
Analysis: Automated Workflow and Decision Making
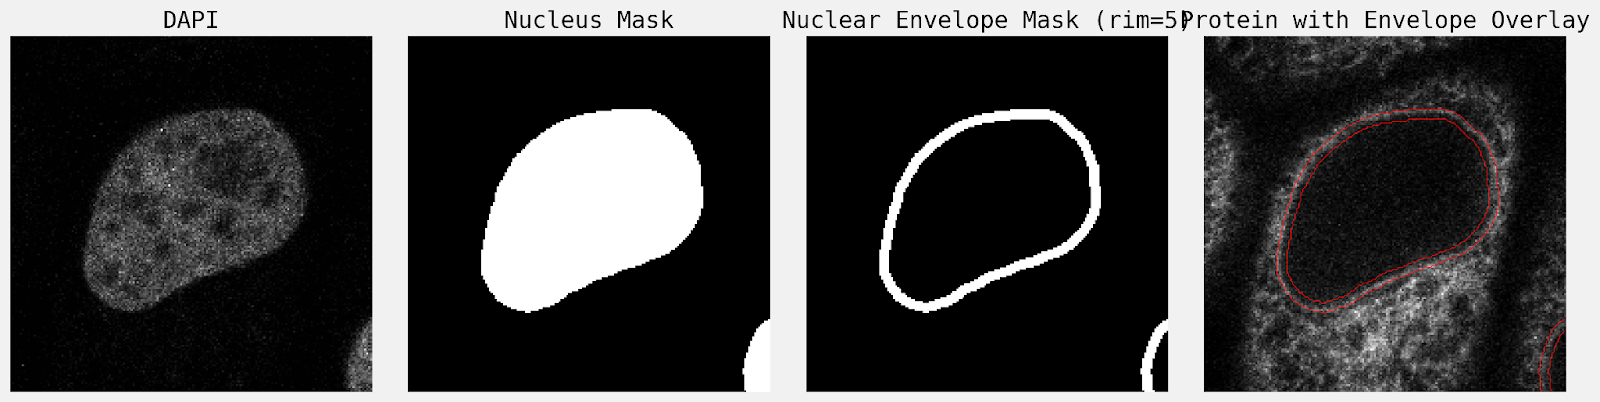
Microscopic image analyses are often challenging to automate, as steps such as threshold selection and segmentation quality control often require expert input. Instruction was given to ‘create a mask for the nuclear envelope per timepoint’. To achieve this, the agent performed the following image processing steps:
- Noise Reduction: Applied a Gaussian smoothing filter.
- Segmentation: Utilized Otsu’s method to automatically calculate a threshold for the DAPI nuclear stain.
- Morphological Cleaning: Used a disk-shaped opening element to remove artifacts while preserving nuclear shape.
- Boundary Definition: Performed a morphological erosion to define the inner boundary. The final nuclear envelope was defined as the XOR difference between the original nuclear mask and the eroded mask.
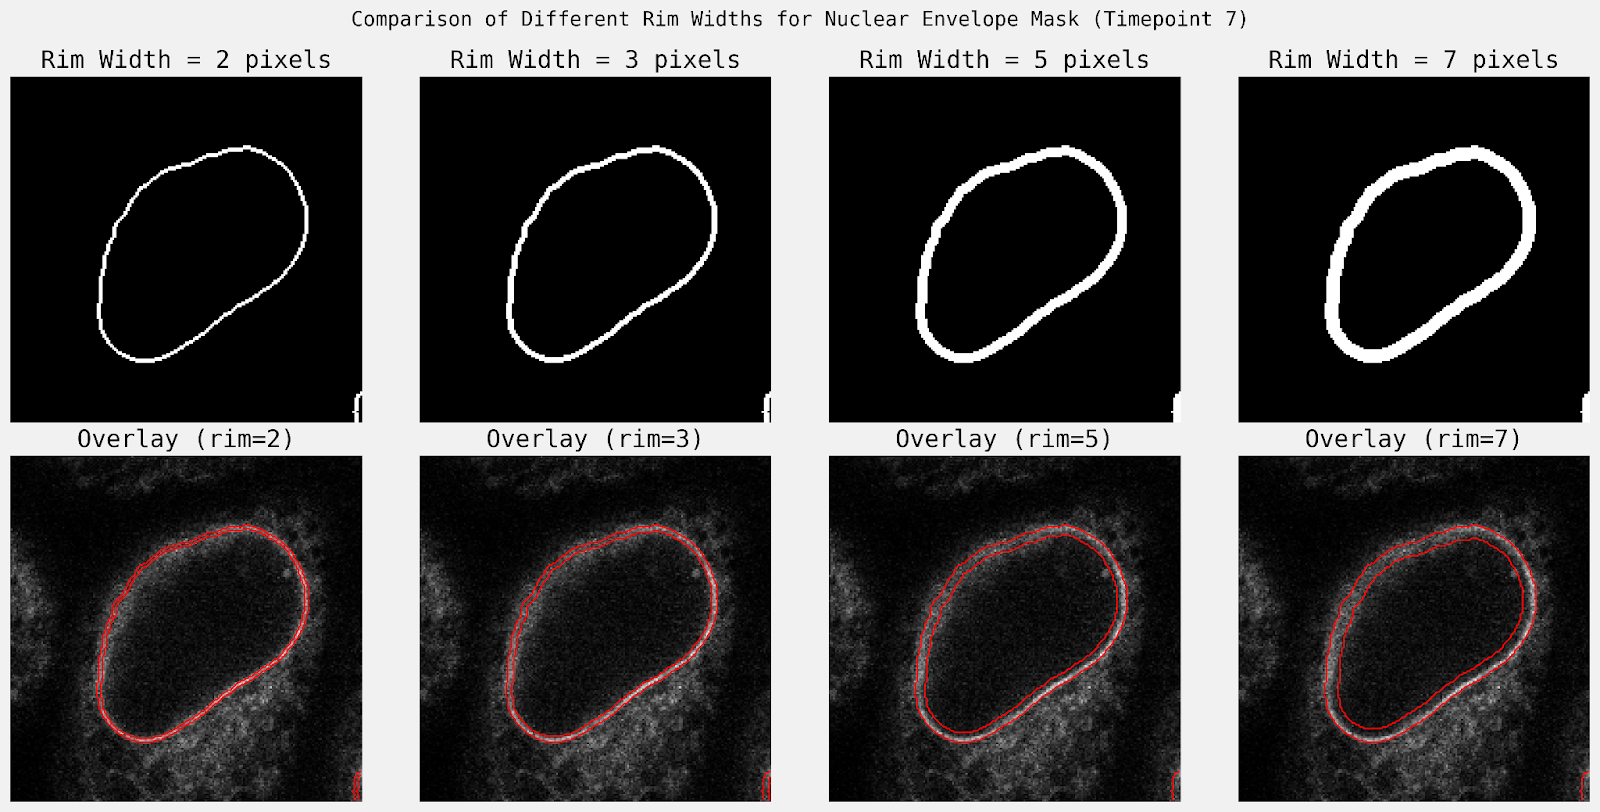
A standout feature of this run was the agent’s discretionary decision-making regarding the thickness of the envelope mask. When prompted to “ensure the rim size of the mask is covering expected nuclear envelope staining”, it tested multiple widths and compared the resulting mean intensities. It concluded that a 3-pixel rim was optimal, as it captured the highest concentration of signal at the membrane (57.6 units) compared to wider masks (e.g., 48.6 units at 5 pixels), which diluted the signal with non-envelope pixels.
Results: Intensity Quantification and Further Finetuning
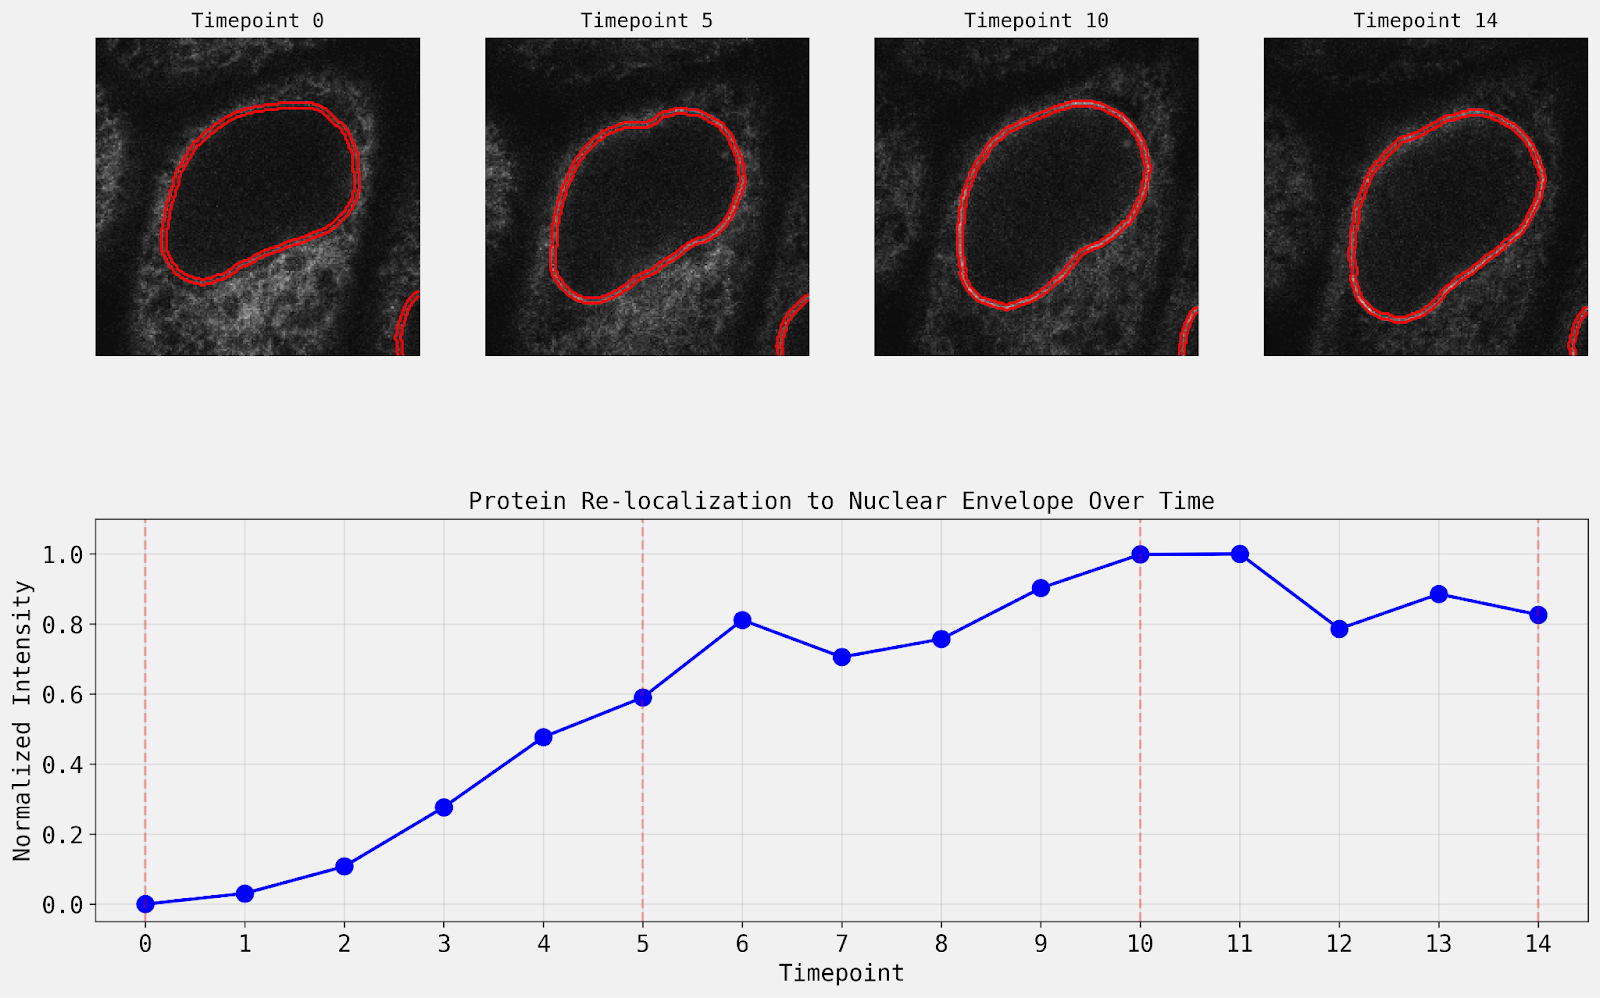
The agent’s quantitative output is comparable to the expected results from the scikit-image example, that fluorescence intensity at the nuclear envelope increases in the initial five time points, then remains roughly constant. Notably, the original example removed objects touching the border, which this trajectory did not, and therefore the results included the incomplete nucleus at the bottom right corner of the image.
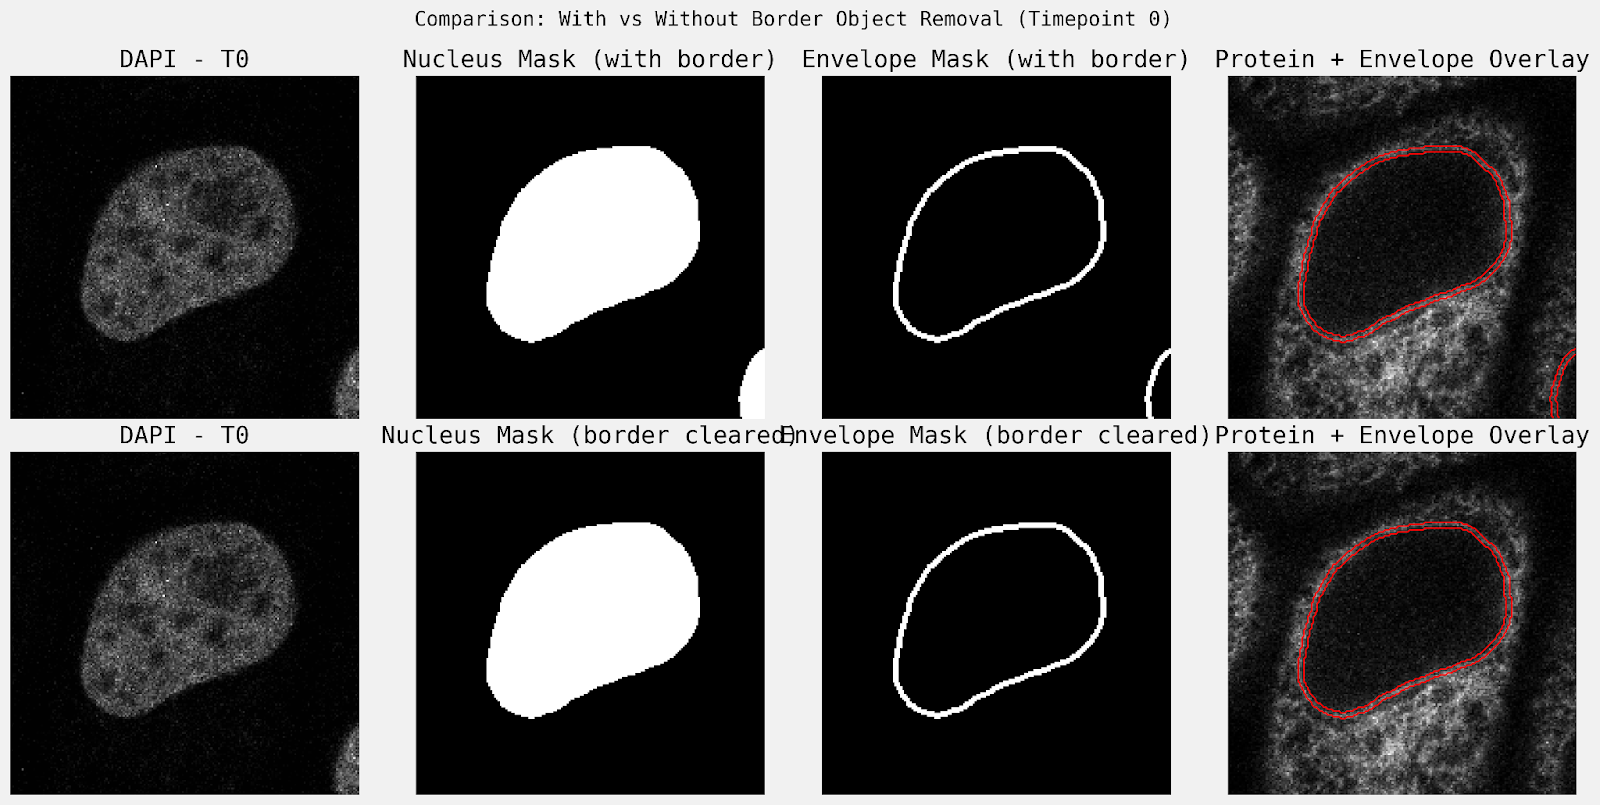
To fine tune the results, a follow up task was submitted to “remove any objects touching the image border”. The subsequent trajectory removed border-touching objects after the initial nucleus segmentation step (Figure 4), and repeated the analysis.
Conclusion
The Edison Analysis agent successfully reproduced the findings of the original scikit-image example. By autonomously optimizing mask parameters, the agent demonstrated that it can handle the nuanced discretionary decisions typically reserved for human researchers. Upon evaluation post-analysis, users can also submit follow up tasks to tailor the methods if needed. This capability significantly reduces the manual efforts required for similar high-content screening and time-series microscopy analysis.