Reproducing Results on the Genotype Driven Gene Expression Similarities and Divergences of Autism Spectrum Disorder Forms during Development
Asmamaw (Oz) Wassie, Michaela Hinks
Date:
02.27.2026
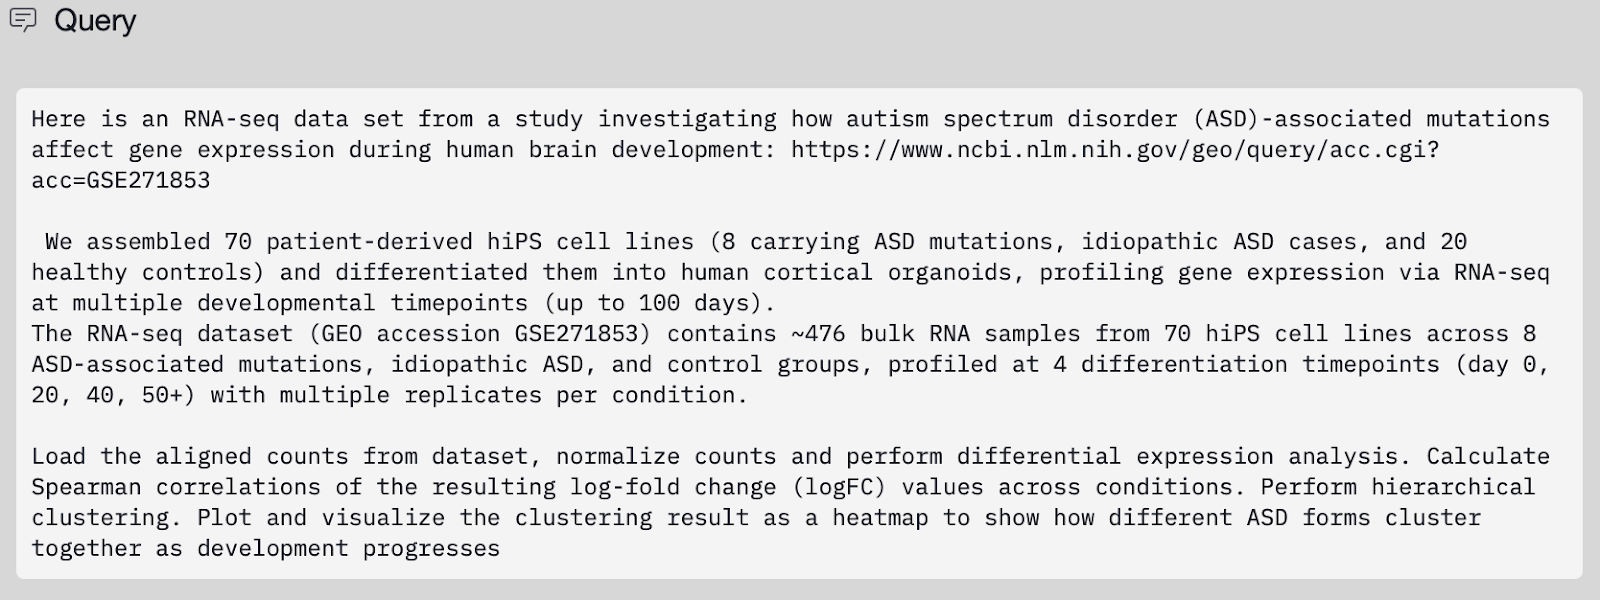
Autism spectrum disorder (ASD) is highly heterogeneous, and a major open question is how diverse genetic risk factors perturb early human cortical development and whether those distinct trajectories ultimately converge on shared molecular programs. In a recent Nature article, Gordon et al. addressed this problem by profiling transcriptomes from patient iPSC-derived human cortical organoids (hCOs) across early developmental time points, showing that ASD forms exhibit strong genotype-linked similarity in gene expression (recapitulating well-known genotype pairings) while also displaying their largest divergences from controls at the earliest stages, with increasing convergence later in development. Here, we demonstrate that the Edison Analysis Agent can autonomously process the same transcriptomic data and recapitulate these key findings, using an end-to-end workflow to recover the genotype-driven clustering structure (mirroring the paper’s Figure 2A) and reproduce the early time point peak in differential expression relative to normal samples (mirroring Figure 2B). The publicly available dataset made available by the authors of the papers consists of bulk RNA-seq studies from hCOs of different ASD genotypes at different developmental stages.
Edison Analysis Agent Recapitulates Genotype based similarities in Transcriptional Profiles of ASD Forms
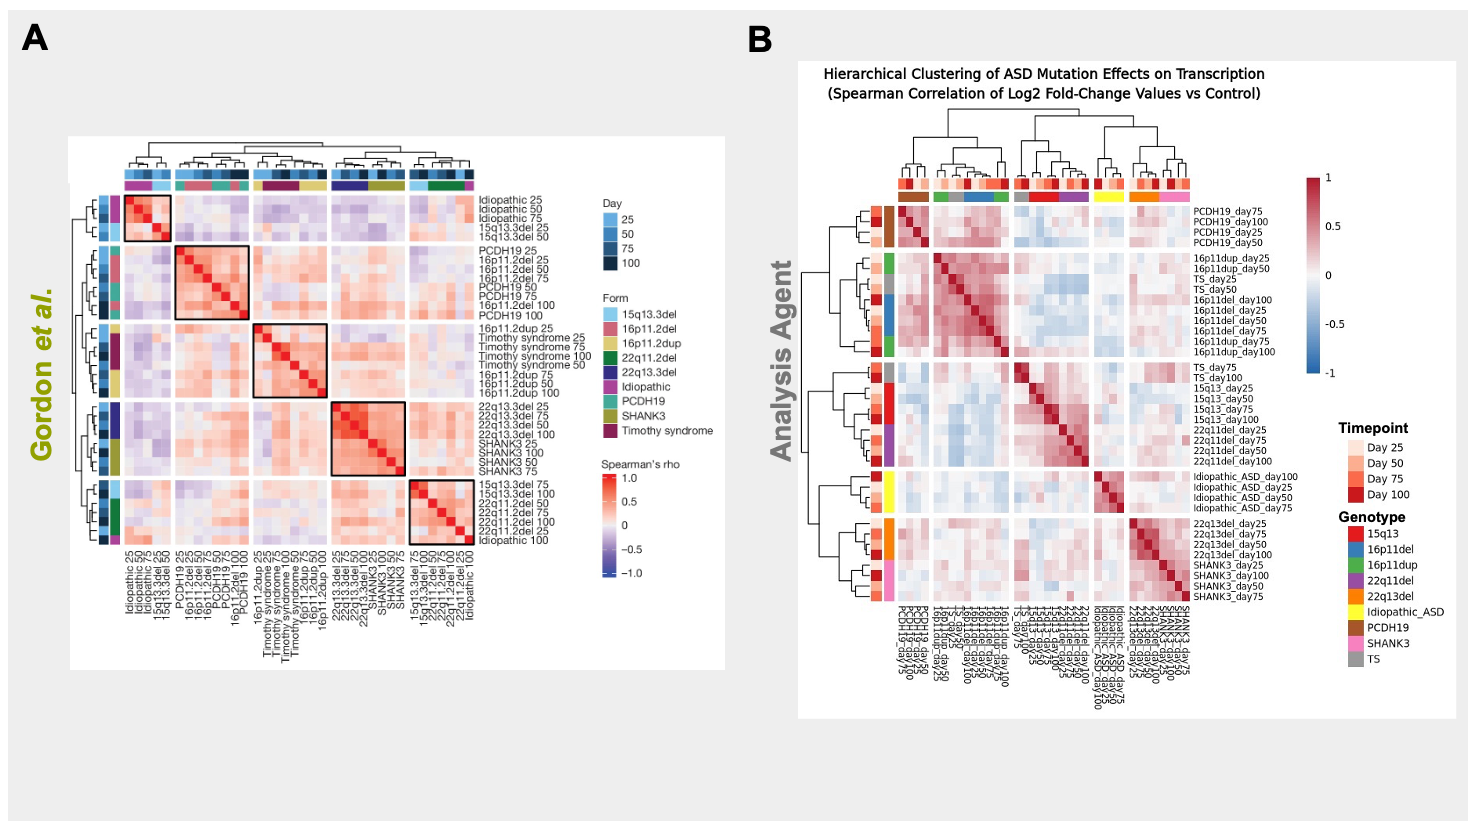
We initially sought to reproduce one of the key findings of the Gordon et al. work (Figure 2A in their manuscript) that ASD forms show gene expression similarities based on their genotypes. We first provided the Edison Analysis Agent with a prompt (Figure 1) as well as a link to the GEO dataset repository created by the authors. The Edison Analysis Agent pulled bulk RNA-seq count data from GEO, spanning 464 samples from 70 patient-derived hiPSC lines differentiated into cortical organoids across four developmental stages (days 25, 50, 75, and 100) and covering nine ASD-associated genotypes alongside healthy controls. Starting from the full 17,963-gene count matrix, the Agent normalized expression using DESeq2’s median-of-ratios method and performed differential expression at each time point by comparing each genotype to controls (Analysis Trajectory). It then treated each genotype–timepoint comparison as a condition and computed a Spearman correlation matrix over log2 fold-change profiles across all 36 conditions, followed by complete-linkage hierarchical clustering using correlation distance (1 − ρ).
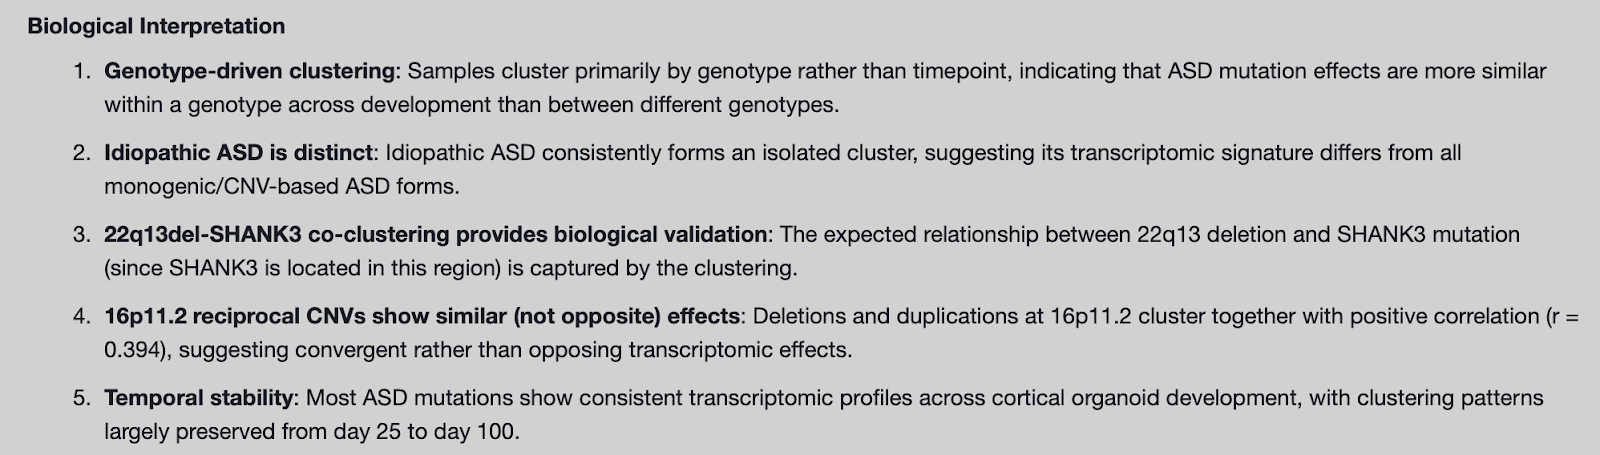
In the Gordon et al. paper, the authors performed hierarchical clustering on gene-expression signatures across ASD genotypes and developmental time points (Figure 2A). Their analysis showed that samples cluster primarily by genotype—often consistently across days—highlighting reproducible, biologically meaningful relationships. The Edison Analysis Agent similarly recovered 5 major cluster groups (Figure 2B). These clusters mirror the paper’s findings on the genotype-driven organization of ASD, including microdeletion syndromes (15q13del + 22q11del), reciprocal 16p11.2 CNVs clustering together with Timothy Syndrome, and—most importantly—the biologically expected co-clustering of 22q13 deletion with SHANK3, which acts as a built-in validation. Consistent with Gordon et al., the clustering was dominated by genotype rather than time point, with many mutation signatures remaining stable from day 25 through day 100. One clear difference the Agent highlighted is that idiopathic ASD forms an isolated cluster, reinforcing how distinct its transcriptomic profile is relative to monogenic and CNV-driven ASD forms.
Furthermore, as part of its autonomous data exploration, the Edison Analysis agent provided biological interpretation of its results (Figure 3).
Edison Analysis Agent Reveals Divergence in Gene Expression of ASD forms at Early Time Points
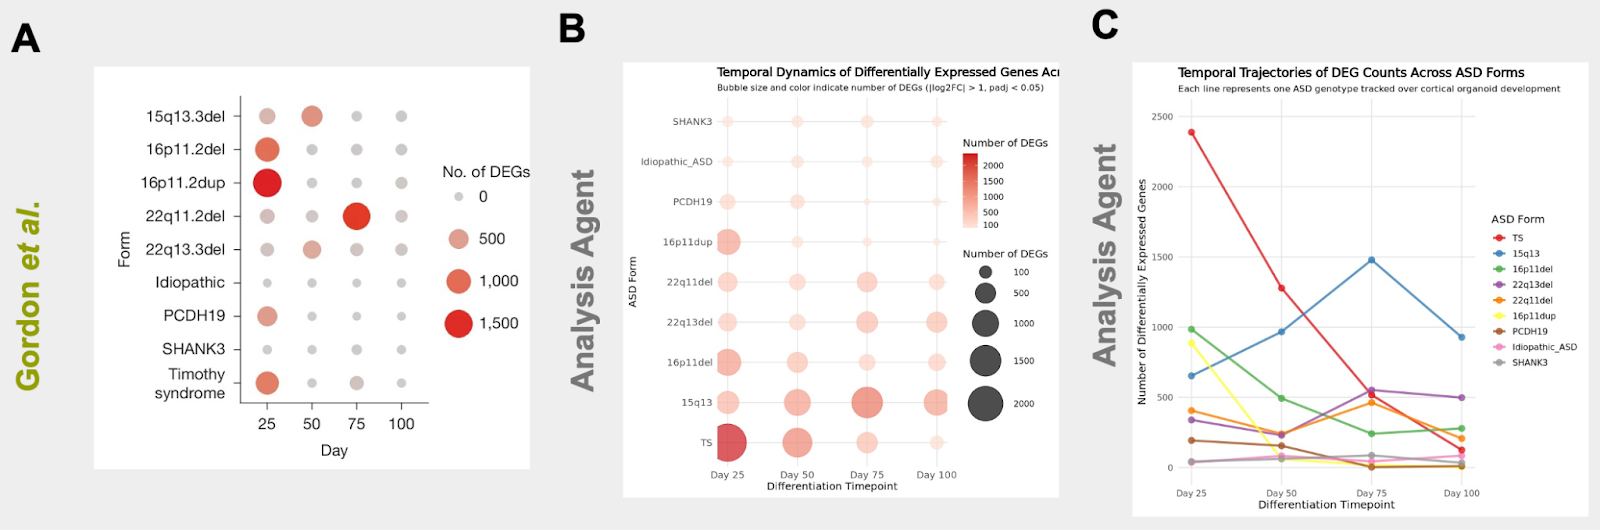
One of the key findings of the manuscript is that ASD mutations produce their strongest molecular separation from normal samples at the earliest stages of cortical development, while converging in later stages. In their work, the authors quantify how far each ASD form diverges from control by plotting the number of differentially expressed genes across developmental time, showing that the largest transcriptional disruptions emerge early (particularly at day 25, and for some forms day 50) and then generally diminish as organoids mature (Figure 4A). In a follow up run, we prompted the Edison Analysis Agent to investigate how differentially expressed genes (DEGs) in different ASD forms change over time (Analysis Trajectory). The Edison Analysis Agent quantified the number of differentially expressed genes vs. controls for each ASD form at days 25, 50, 75, and 100 (using |log2FC| > 1 and adjusted p < 0.05 as the DEG cutoff). It recovered the same trend as the paper: transcriptomic disruption is strongest early and generally declines with development, with the cohort-wide mean dropping from ~659 DEGs at day 25 to ~241 at day 100 (a ~63% reduction) (Figure 4B, C). The Agent also surfaced genotype-specific trajectories that fit that framework. Most forms show an early-peak pattern (including dramatic “collapse” cases like 16p11.2dup and TS), while a smaller subset shows later or increasing effects (notably 15q13del and 22q13del). Taken together, this recapitulates the paper’s “early divergence, later convergence” finding, while adding a clearer sense of which ASD forms drive the strongest early separation from controls versus those with delayed or progressive divergence.
While the Edison Analysis Agent qualitatively recapitulated the trend in the early divergence of ASD forms and later convergence, some genotypes show different DEG magnitudes and peak timing compared to the Gordon et al. paper. These differences are expected because the Agent used a timepoint-by-timepoint framework with an explicit |log2FC| threshold to determine DEGs, whereas the paper’s counts reflect a different statistical approach and filtering/thresholding choices, which can materially shift DEG calls.
In summary, these autonomous reproductions by the Edison Analysis Agent underscore both the impact of the Gordon et al. study and the opportunity created when high-quality, well-annotated datasets are made openly available: they enable independent validation, rapid iteration, and deeper re-use by the broader community. Using the same public dataset, the Edison Analysis Agent reproduced two core results: first, that ASD forms occupy a genotype-structured transcriptional landscape, recovering major genotype-linked groupings and showing that many mutation signatures remain stable across developmental stages; and second, that ASD-associated perturbations exhibit a pronounced early developmental divergence from controls that generally diminishes with maturation, consistent with an overall “early divergence, later convergence” trajectory. In aggregate, these reproductions support the paper’s conclusion that early cortical development represents a period of heightened vulnerability to ASD-associated genetic perturbation, while later stages show increasing convergence of transcriptional programs. Gordon et al. provide an essential foundation and a compelling developmental framework for ASD; tools like the Edison Analysis Agent can help make that kind of rigorous, large-scale analysis faster to explore, easier to interrogate, and more broadly actionable.